The lowest annual value among the 11 stations in 2025, in micrograms per cubic metre, compared with 38.77 at Mihai Bravu.
The law allows 35 days a year of PM10 above 50. Obor reached 48, Colentina 47 and Voluntari 39.
In the cold season, PM2.5 concentrations at most stations were roughly double the summer level, mainly because of solid-fuel heating.
From 2030 the annual EU NO₂ limit falls to 20. According to Ecopolis, eight of the 11 stations would exceed it.
The nearest station, a winter evening visit, distance from the road, how the neighbours heat, and not relying on a map alone.
Air quality in Bucharest and Ilfov: the short answer
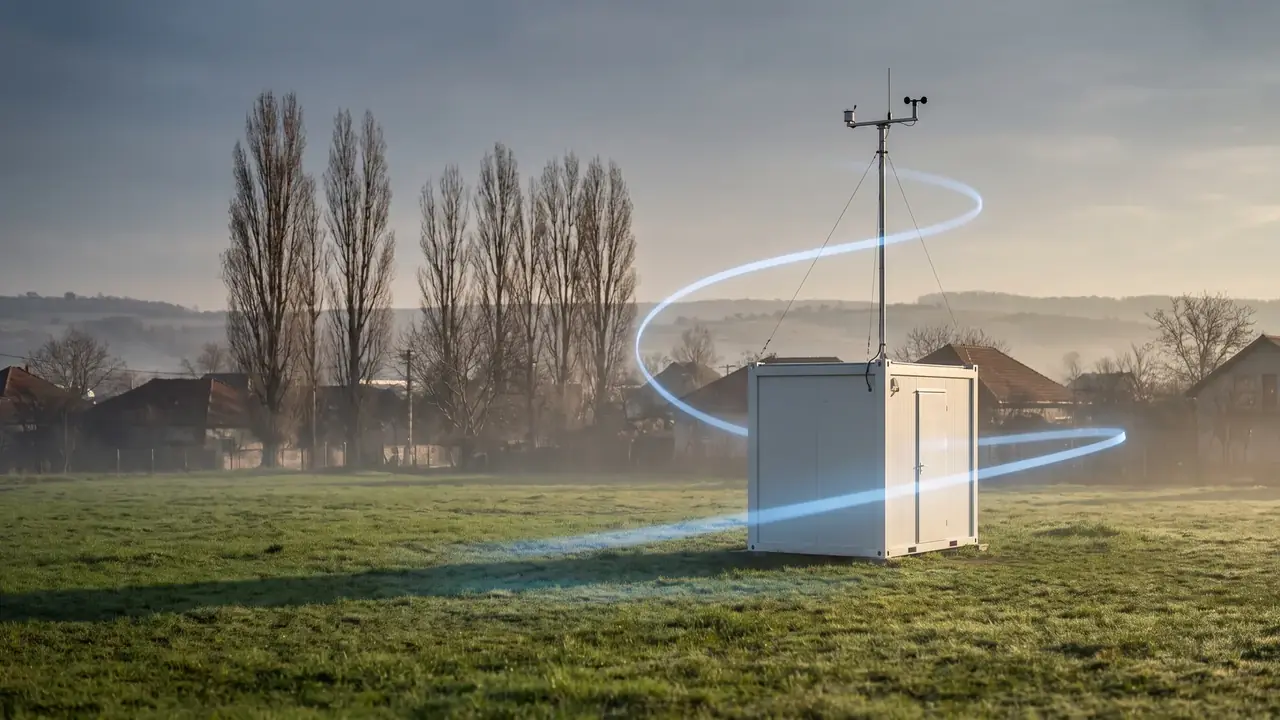
According to an analysis by the organisation Ecopolis of national monitoring network data for 2025, the main problem in Bucharest and Ilfov is particulate matter (PM10 and PM2.5), above all in winter. The most problematic areas are Obor, Colentina and Voluntari. For nitrogen dioxide (NO₂), which comes mainly from traffic, the lowest annual value among the 11 stations was measured in Balotești: 8.84 micrograms per cubic metre, compared with 38.77 at Mihai Bravu. In winter, home heating with wood raises particulate levels almost everywhere. As of October 2026.
I write this with care, because we are building in Balotești, and a good number about your own location always sounds like advertising. So I will present the data as it is, including what it does not say.
Where the data comes from
Romania has a national air quality monitoring network (RNMCA), with automatic stations measuring pollutants every hour. The public data is available on the network's website, calitateaer.ro.
Bucharest and Ilfov have several such stations, and one of them is in Balotești: a background station outside the city, designed to measure air away from direct pollution sources. The analysis I quote here is the Ecopolis report for 2025, published in June 2026 and based on national network data. Ecopolis is a civil society organisation, not a government authority.
Particulate matter: where the limits are exceeded
The law allows up to 35 days a year on which the daily average of PM10 exceeds 50 micrograms per cubic metre. In 2025, three areas went over the allowance:
| Area | Days exceeding PM10 in 2025 | Beyond the allowance |
|---|---|---|
| Obor / Veranda | 48 | 13 days |
| Colentina | 47 | 12 days |
| Voluntari | 39 | 4 days |
For PM2.5, the fine particles that penetrate deep into the lungs, the highest annual values were measured at Chiajna-Militari (20.78, based on only 217 days of measurement), Vitan-Dudești (20.27), Colentina (19.01), Voluntari (18.86) and Sintești (18.47). According to Ecopolis, only Vitan-Dudești officially counts as exceeding the annual limit of 20.
The areas with the lowest PM2.5 were Politehnica and Bulevardul Iuliu Maniu, Universitate, Măgurele and Drumul Taberei.
NO₂: traffic, and the number from Balotești
Nitrogen oxides are the best indicator of the impact of traffic. The current annual EU limit is 40 micrograms per cubic metre, according to the European Commission. No station exceeded it in 2025:
| Station | Annual NO₂, micrograms per cubic metre |
|---|---|
| Mihai Bravu | 38.77 |
| Universitate, Cercul Militar | 38.34 |
| Bragadiru, Alexandriei | 35.33 |
| Crângași | 27.31 |
| Drumul Taberei | 26.63 |
| Chiajna-Militari | 18.81 |
| Măgurele | 17.41 |
| Balotești | 8.84 |
The value in Balotești is four times lower than at the busy junctions in the city, and that is what happens when the station is far from traffic. But it is one station, and one point does not represent every street in the commune. A home right by the DN1 breathes differently from a home on a side street.
Winter changes the picture
The most important finding in the report, in my view, is the seasonal one. In the cold season, from 20 October to 31 March, PM2.5 concentrations at many stations were roughly double those in summer, meaning 2 times higher. The largest gaps were measured in Voluntari, Chiajna-Militari, Giulești and Sintești, and Ecopolis attributes them to home heating with solid fuel and to burning.
The value in Balotești is four times lower than at the busy junctions in the city, and that is what happens when the station is far from traffic.
G4Media also reported that city hall is planning a programme for about 18,600 homes in Bucharest heated with wood or coal, and that a representative of the prefecture mentioned illegal waste burning in Sintești.
What this means for the suburbs: clean air in summer does not guarantee clean air in winter. A village where neighbours heat with wood can feel different on a winter evening, even if the nearest station shows a good average.
What the data does not say
Before drawing conclusions about a neighbourhood, it is worth knowing the limitations:
- Few stations, a large area. The NO₂ analysis is based on only 11 stations for all of Bucharest and Ilfov. Corbeanca, Snagov and Otopeni have no row of their own in the table.
- Not every station worked all year. The Chiajna-Militari value, for example, is based on 217 days, so it will not be included in official reporting.
- Only three pollutants. The report analyses PM10, PM2.5 and NO₂. Other pollutants the network measures were not included.
- Independent sensors are an indication. They are useful for seeing a trend on your street, but they are no substitute for an official station.
What to expect in 2030
EU Directive 2024/2881 lowers the annual NO₂ limit from 40 to 20 micrograms, from 2030. According to Ecopolis, eight of the 11 stations (8 of 11) would exceed the new limit. Only Chiajna-Militari, Măgurele and Balotești would meet it. This is one of the reasons Bucharest city hall has proposed restricting older cars, as we explained in our article on the low emission zone.
How to check the air before buying
- Check the nearest station. On calitateaer.ro you can see data by station, and Ecopolis's aerlive.ro also includes independent sensors.
- Visit on a winter evening. Not only on a spring morning. Check whether there is a smell of smoke in the neighbourhood.
- Check the distance from the main road. NO₂ falls quickly as you move away from a busy road.
- Ask how the neighbours heat their homes. Gas, heat pumps or wood. In a new development, everyone is on the same system.
- Do not rely on a colourful map alone. Ecopolis itself warns that its interpolation map is a spatial estimate between stations, not a measurement at every point.
Who this matters to most
It matters most to: families with young children, people with asthma or allergies, and older people. For them, choosing a neighbourhood is also a health choice.
It matters less to: people looking for a property for short periods in the city, or people who already live and work in the centre and accept the price of city life.
Frequently asked questions
Where is the air most polluted in Bucharest?
According to the Ecopolis analysis of 2025 data, Obor, Colentina and Voluntari exceeded the allowed number of PM10 days, and for PM2.5 the highest values were measured at Chiajna-Militari, Vitan-Dudești, Colentina, Voluntari and Sintești.
What is the air quality in Balotești?
The monitoring station in Balotești recorded the lowest annual NO₂ value among the 11 stations in 2025, 8.84 micrograms per cubic metre. It is one station, and in winter wood heating nearby can affect particulate levels.
Why does pollution rise in winter?
According to Ecopolis, PM2.5 concentrations in the cold season are almost double those in summer at most stations, mainly because of home heating with solid fuel, such as wood and coal, and burning.
Where can I see real-time air quality data?
On the national network's website, calitateaer.ro, and on the aerlive.ro platform, which combines network data, the city hall network and independent sensors.
Does Bucharest meet EU standards?
For NO₂ yes, under the current limit of 40 micrograms, but only just at the busy junctions. For PM10, three areas exceeded the limit in 2025. From 2030, with an NO₂ limit of 20, most stations would exceed it.
The bottom line
Around Bucharest, clean air is found far from traffic and from wood heating. The suburbs outside the city, Balotești among them, look better in the NO₂ data, but winter is the real test, and you check it on the street itself.
If you are looking at areas in north Bucharest and would like to go through the data together, book a 30-minute call with me. For a general comparison between parts of the city, see north or south Bucharest, and for life by the water in the suburbs, see our article on living by a lake in Ilfov.
Moti Azulay, Compass Group Romania
Sources and data: Ecopolis: air pollution in Bucharest and Ilfov, 2025 · National air quality monitoring network (calitateaer.ro) · aerlive.ro · European Commission: air quality standards · EU Directive 2024/2881 · G4Media: the emission zone proposal and home heating · Spotmedia: the emission zone timetable.
This article is for general information only and is not legal, tax, financial or medical advice. The data is based on a civil society organisation's analysis of national network data for 2025, and varies from year to year and from point to point.
Now you know more.

This article is general information, not legal, tax or financial advice. Consult local professionals before any transaction.