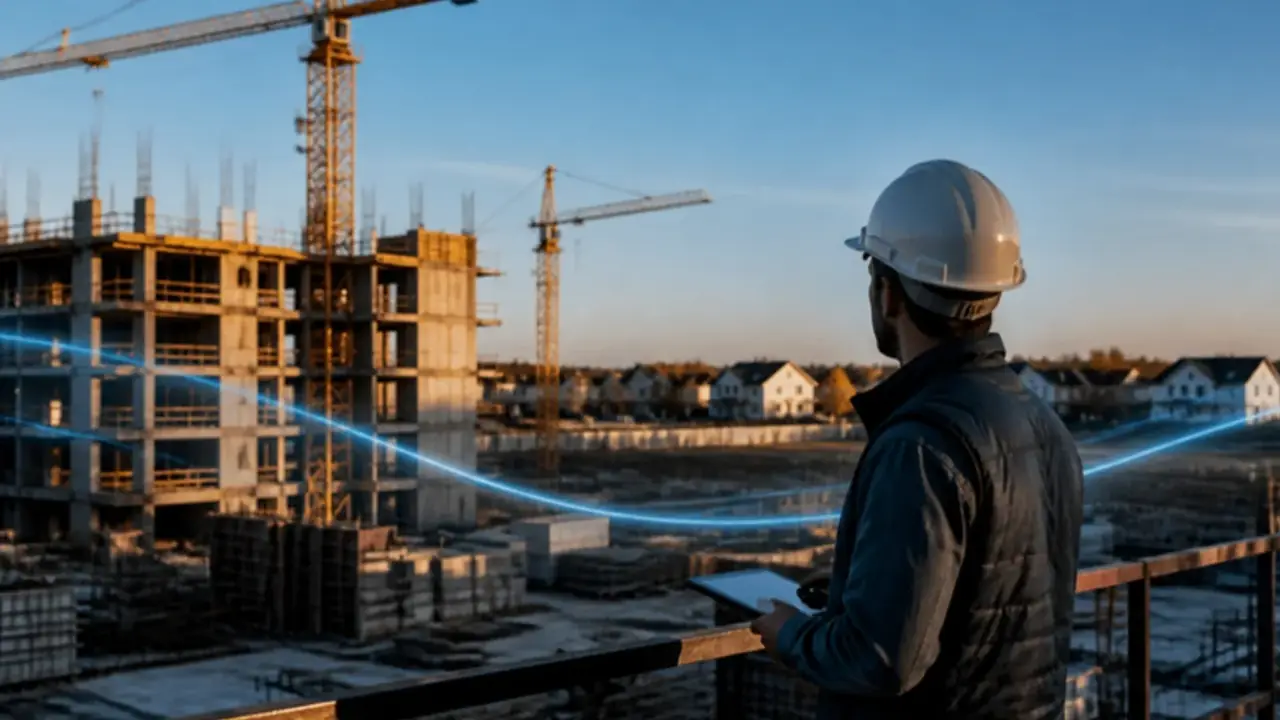
9,361 in Bucharest and 7,932 in Ilfov, according to INS. At the 2021 peak the region completed 22,010.
Almost 10,800 homes were completed in Bucharest–Ilfov in the first half of 2026, per INS data compiled by SVN Romania.
5,483 of the 7,932 homes completed in Ilfov in 2025 were financed by private individuals. In Bucharest: 556 of 9,361.
New housing supply in Bucharest and Ilfov: the short answer
According to the National Institute of Statistics (INS), 17,293 dwellings were completed in the Bucharest–Ilfov region in 2025: 9,361 in Bucharest and 7,932 in Ilfov. That is well below the 2021 peak of 22,010. In the first half of 2026 deliveries rose sharply: almost 10,800 homes, up 53.6% on a year earlier, according to INS data compiled by SVN Romania.
The permits tell the story behind this. The usable floor area approved for residential buildings in the region fell from about 3.37 million m² in 2022 to about 1.83 million m² in 2024, and then rose again, to about 2.52 million m² in 2025. Permits come first, completions follow.
In plain words: new supply in Bucharest moves in waves, and the permits issued today shape what can be finished over the next few years.
The broader picture of Ilfov's population growth is in our article on Ilfov County's growth. Here we look at the pipeline itself.
Completions: a decade in numbers
| Dwellings completed (INS) | 2019 | 2021 | 2023 | 2024 | 2025 |
|---|---|---|---|---|---|
| Bucharest | 8,647 | 13,344 | 13,834 | 9,381 | 9,361 |
| Ilfov | 6,185 | 8,666 | 6,732 | 7,598 | 7,932 |
| Bucharest–Ilfov region | 14,832 | 22,010 | 20,566 | 16,979 | 17,293 |
| Romania | 67,488 | 71,405 | 70,957 | 60,978 | 59,062 |
Source: INS, TEMPO database, table LOC104A, updated 21 July 2026.
Three things stand out. Bucharest's completions dropped by about a third between 2023 and 2024 and stayed there in 2025. Ilfov moved the other way and grew in both years. And the region still delivers close to 30% of all new homes in Romania.
Permits: the leading indicator
A building permit is the step before construction. INS counts both the number of permits for residential buildings and the usable floor area they cover. The area matters more: one permit in Bucharest can be a tower of hundreds of flats, while one permit in Ilfov is often a single house.
| Residential building permits (INS) | 2021 | 2022 | 2023 | 2024 | 2025 |
|---|---|---|---|---|---|
| Bucharest, number | 632 | 486 | 395 | 387 | 403 |
| Bucharest, usable area (m²) | 1,677,009 | 2,027,949 | 929,891 | 855,080 | 1,110,066 |
| Ilfov, number | 6,133 | 4,789 | 3,232 | 3,446 | 3,610 |
| Ilfov, usable area (m²) | 1,435,559 | 1,342,021 | 1,040,886 | 979,464 | 1,408,904 |
Source: INS, TEMPO database, table LOC108A, updated 29 September 2026.
The sequence is visible in the data: the permitted area fell sharply in 2023 and 2024, and completions in Bucharest fell in 2024 and stayed low in 2025. In 2025 the permitted area rose again in both counties.
2026 continues that turn. From January to August 2026, the region issued 2,574 residential permits, four more than in the same months of 2025, and the only region in Romania with an increase. The usable area rose more: about 1.84 million m², against about 1.45 million m² a year earlier. Nationally, residential permits fell 12.2% in the same period.
A permit is not a finished home. Projects are delayed, redesigned or never started. Read permits as the size of the pipeline, not as a delivery schedule.
New supply in Bucharest moves in waves, and the permits issued today shape what can be finished over the next few years.
Who builds: developers in the city, families in Ilfov
INS also splits completions by who paid for them. The category "from the population's funds" covers homes financed by private individuals, as opposed to companies or the state.
| Completed in 2025 (INS) | Total | Financed by private individuals | Share |
|---|---|---|---|
| Bucharest | 9,361 | 556 | about 6% |
| Ilfov | 7,932 | 5,483 | about 69% |
Source: INS, TEMPO, LOC104A. Shares are our calculation.
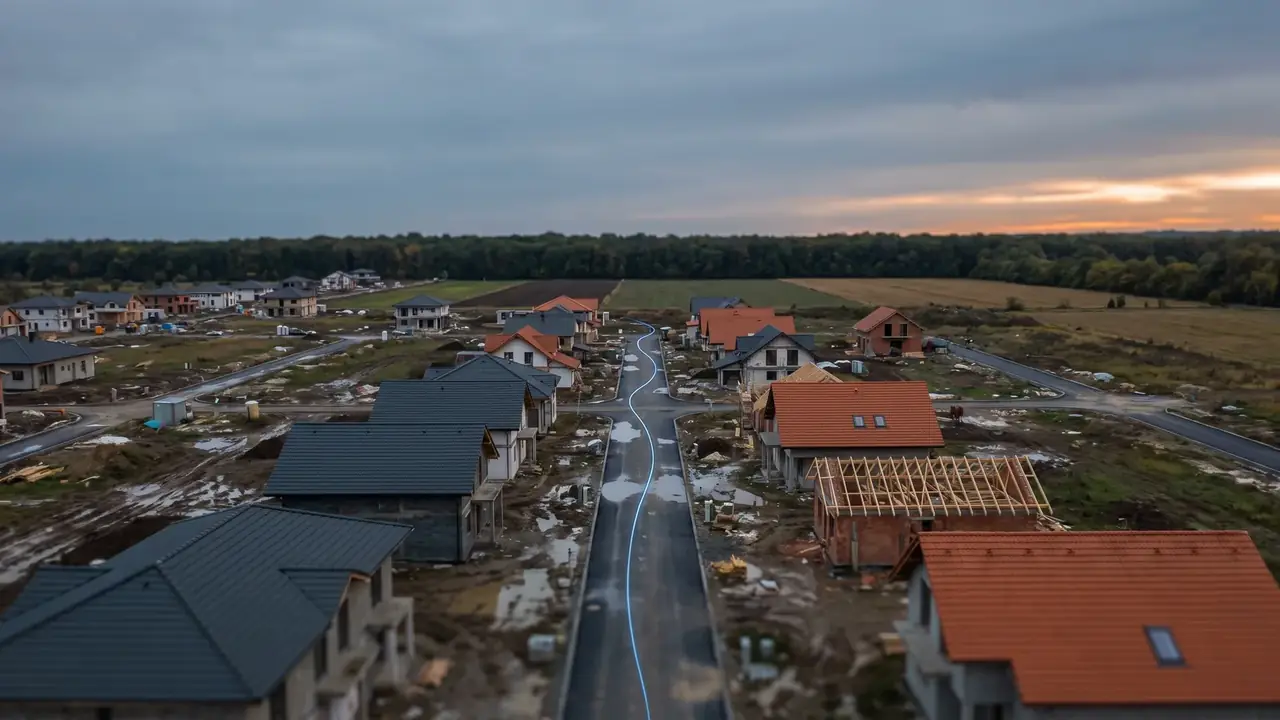
These are two different markets. In Bucharest, new supply means developer projects, mostly apartment blocks. In Ilfov, most new homes are houses that families build for themselves, alongside developer projects. That affects what you compare when you look at a new villa: a self-built house on a plot and a home in a planned community with shared infrastructure are not the same product.
Commune by commune: where Ilfov builds
INS publishes completions down to the level of each town and commune. A selection from the north of Bucharest:
| Dwellings completed | 2021 | 2022 | 2023 | 2024 | 2025 |
|---|---|---|---|---|---|
| Voluntari | 763 | 916 | 1,341 | 1,052 | 862 |
| Tunari | 926 | 953 | 706 | 682 | 751 |
| Ștefăneștii de Jos | 164 | 368 | 64 | 237 | 346 |
| Otopeni | 680 | 656 | 441 | 568 | 308 |
| Balotești | 203 | 259 | 220 | 178 | 158 |
| Snagov | 39 | 114 | 85 | 101 | 137 |
| Corbeanca | 363 | 366 | 258 | 176 | 65 |
| Mogoșoaia | 234 | 402 | 29 | 76 | 24 |
Source: INS, TEMPO, table LOC104B, updated 21 July 2026.
Small communes swing a lot from year to year. One large project finished, or not, can double or halve the number.
What drives new supply
The data shows the result. These are the forces that sit behind it, as far as they can be documented:
- The permit cycle. The fall in permitted area in 2023 and 2024 came before the fall in completions. The rise in 2025 and 2026 is already visible in permits.
- Rules and paperwork. Zoning plans and permits decide what can be built on a plot. Since 25 August 2026, permits are issued under the new Planning and Construction Code, Law 169/2026, which replaced the old construction law. Our guide to checking the building permit and zoning explains what to look at.
- Tax. New homes carry 21% VAT. The reduced 9% rate for qualifying homes is gone, and SVN Romania links the 2025 sales pattern to that change. See VAT on new homes.
- Self-build in Ilfov. Most new homes in Ilfov are financed by private individuals, so land, utilities and family budgets matter as much as developer pipelines.
- When a home is counted. A home enters the statistics when it is completed and formally received. SVN notes that official delivery figures depend on construction schedules and reception formalities, so a quarter can jump when several projects are received at once.
How to use supply data as a buyer: a checklist
- Look at area, not number of permits, when comparing Bucharest with Ilfov.
- Check your commune's own line in INS table LOC104B, not only the county total.
- Ask whether the project you are looking at has a permit and see it before you pay. Our article on seeing the building permit before paying shows what to ask.
- Compare like with like. A self-built house and a home in a gated project differ in roads, utilities and management.
- Treat completions as history. They tell you what was finished, not what will be finished.
Frequently asked questions
How many new homes were completed in Bucharest in 2025?
According to INS, 9,361 dwellings were completed in Bucharest in 2025 and 7,932 in Ilfov, 17,293 in the Bucharest–Ilfov region in total.
Are new home completions rising in 2026?
In the first half of 2026, almost 10,800 homes were completed in Bucharest–Ilfov, up 53.6% on the first half of 2025, according to INS data compiled by SVN Romania. The second quarter alone brought almost 7,000.
What do building permit statistics show?
They show how many residential buildings were approved and their usable floor area. From January to August 2026, Bucharest–Ilfov issued 2,574 residential permits, slightly more than a year earlier, covering about 1.84 million m².
Who builds most new homes in Ilfov?
Private individuals. Of 7,932 homes completed in Ilfov in 2025, 5,483 were financed by the population's own funds, according to INS. In Bucharest, the figure was 556 of 9,361.
Where can I find data for a specific commune?
In the INS TEMPO database: table LOC104B for dwellings completed and LOC108B for building permits, both by town and commune.
The bottom line
New supply in Bucharest and Ilfov fell from its 2021 peak, bottomed out in 2024–2025 and is rising again in 2026, first in permits and now in completions. Bucharest builds through developers, Ilfov largely through families. The numbers describe the past and the pipeline. They are not a forecast, and they do not replace checking the permit of the home you want.
If you are comparing new homes north of Bucharest, in our project or any other, book a 30-minute call with me. We will go through the permits, the timeline and the questions to ask each developer.
Moti Azulay, Compass Group Romania
Sources: INS TEMPO database, tables LOC104A, LOC104B and LOC108A · National Institute of Statistics (INS) · Revista Biz, INS data via SVN Romania on Q2 2026 completions, 14 September 2026 · Economica.net / Agerpres, INS building permits January–August 2026, 30 September 2026 · Law 169/2026, Planning and Construction Code, Monitorul Oficial no. 661 of 10 August 2026
This article is for general information only and is not legal, tax or financial advice. Figures are as published by INS on the dates shown; correct as of 22 October 2026. Past data does not indicate future supply or prices.
Now you know more.
This article is general information, not legal, tax or financial advice. Consult local professionals before any transaction.